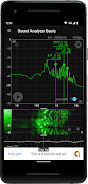
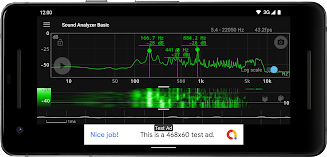
Sound Analyzer Basic is a mobile application designed for real-time analysis of audio signals. It provides a comprehensive view of audio data, displaying frequency (Hz) and amplitude (dB) spectra, spectral changes over time (waterfall view), and sound waveforms simultaneously. The app boasts high frequency measurement accuracy, with a measurement error typically within 0.1Hz in low-noise environments.
Key features of Sound Analyzer Basic include:
- Peak frequency display: Identifies and displays the dominant frequency in the audio signal.
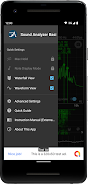
- Touch-based display range adjustment: Allows users to easily adjust the displayed frequency range for focused analysis.
- Switchable frequency axis scale: Offers both logarithmic and linear scales for the frequency axis, providing flexibility in data visualization.
- Waterfall view: Displays spectral changes over time, revealing the evolution of the audio signal.
- Waveform view: Presents the sound waveform, providing a visual representation of the audio signal's structure.
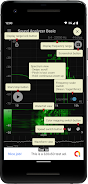
- Screenshot function: Enables users to capture and save images of the displayed data.
The app supports a high frequency range setting up to 96kHz. However, frequencies above 22.05kHz may be filtered out in most devices, resulting in reduced noise levels in that range. It's important to note that certain frequencies, such as 48kHz and 96kHz, might experience increased noise due to filter processing in specific device models.
Here are six advantages of using the Sound Analyzer Basic app:
- Real-time frequency and amplitude display: Provides immediate analysis of audio signals by displaying frequency and amplitude spectra in real time.
- Spectral changes over time: Allows users to monitor the evolution of the audio signal by displaying changes in spectra over time.
- Waveform visualization: Offers a comprehensive view of the audio signal by displaying sound waveforms alongside spectral analysis.
- High measurement accuracy: Delivers highly accurate frequency measurements, with errors typically within -1Hz in low-noise environments.
- Customizable display range: Enables users to adjust the display range through touch operation, allowing for focused analysis of specific frequency ranges.
- Optional frequency axis scale: Provides flexibility in data visualization by offering the option to switch between logarithmic and linear scales for the frequency axis.
v1.13.0
3.00M
Android 5.1 or later
jp.nokubi.nobapp.soundanalyzer.free
This app is a must-have for anyone interested in audio analysis! The real-time display of frequency and amplitude is incredibly useful. The waterfall view and sound waveforms are detailed and informative. Highly recommended!
La aplicación es útil para analizar sonidos en tiempo real, aunque la interfaz podría ser más intuitiva. Me gusta la vista en cascada y las formas de onda, pero a veces el rendimiento es un poco lento.
这款应用对于实时音频分析非常有用!频率和振幅的显示非常清晰,瀑布图和声音波形也很详细。强烈推荐给音频爱好者!
Die App ist nützlich für die Echtzeit-Audioanalyse, aber die Benutzeroberfläche könnte benutzerfreundlicher sein. Die Wasserfallansicht und Wellenformen sind informativ, doch manchmal etwas langsam.
Cette application est parfaite pour l'analyse audio en temps réel! Les spectres de fréquence et d'amplitude sont clairs et précis. La vue en cascade et les formes d'onde sont très utiles. Je recommande fortement!